Hitzefrei
I tried to create a time series plot for the maximum temperature measured in Berlin throughout the last 15 years:
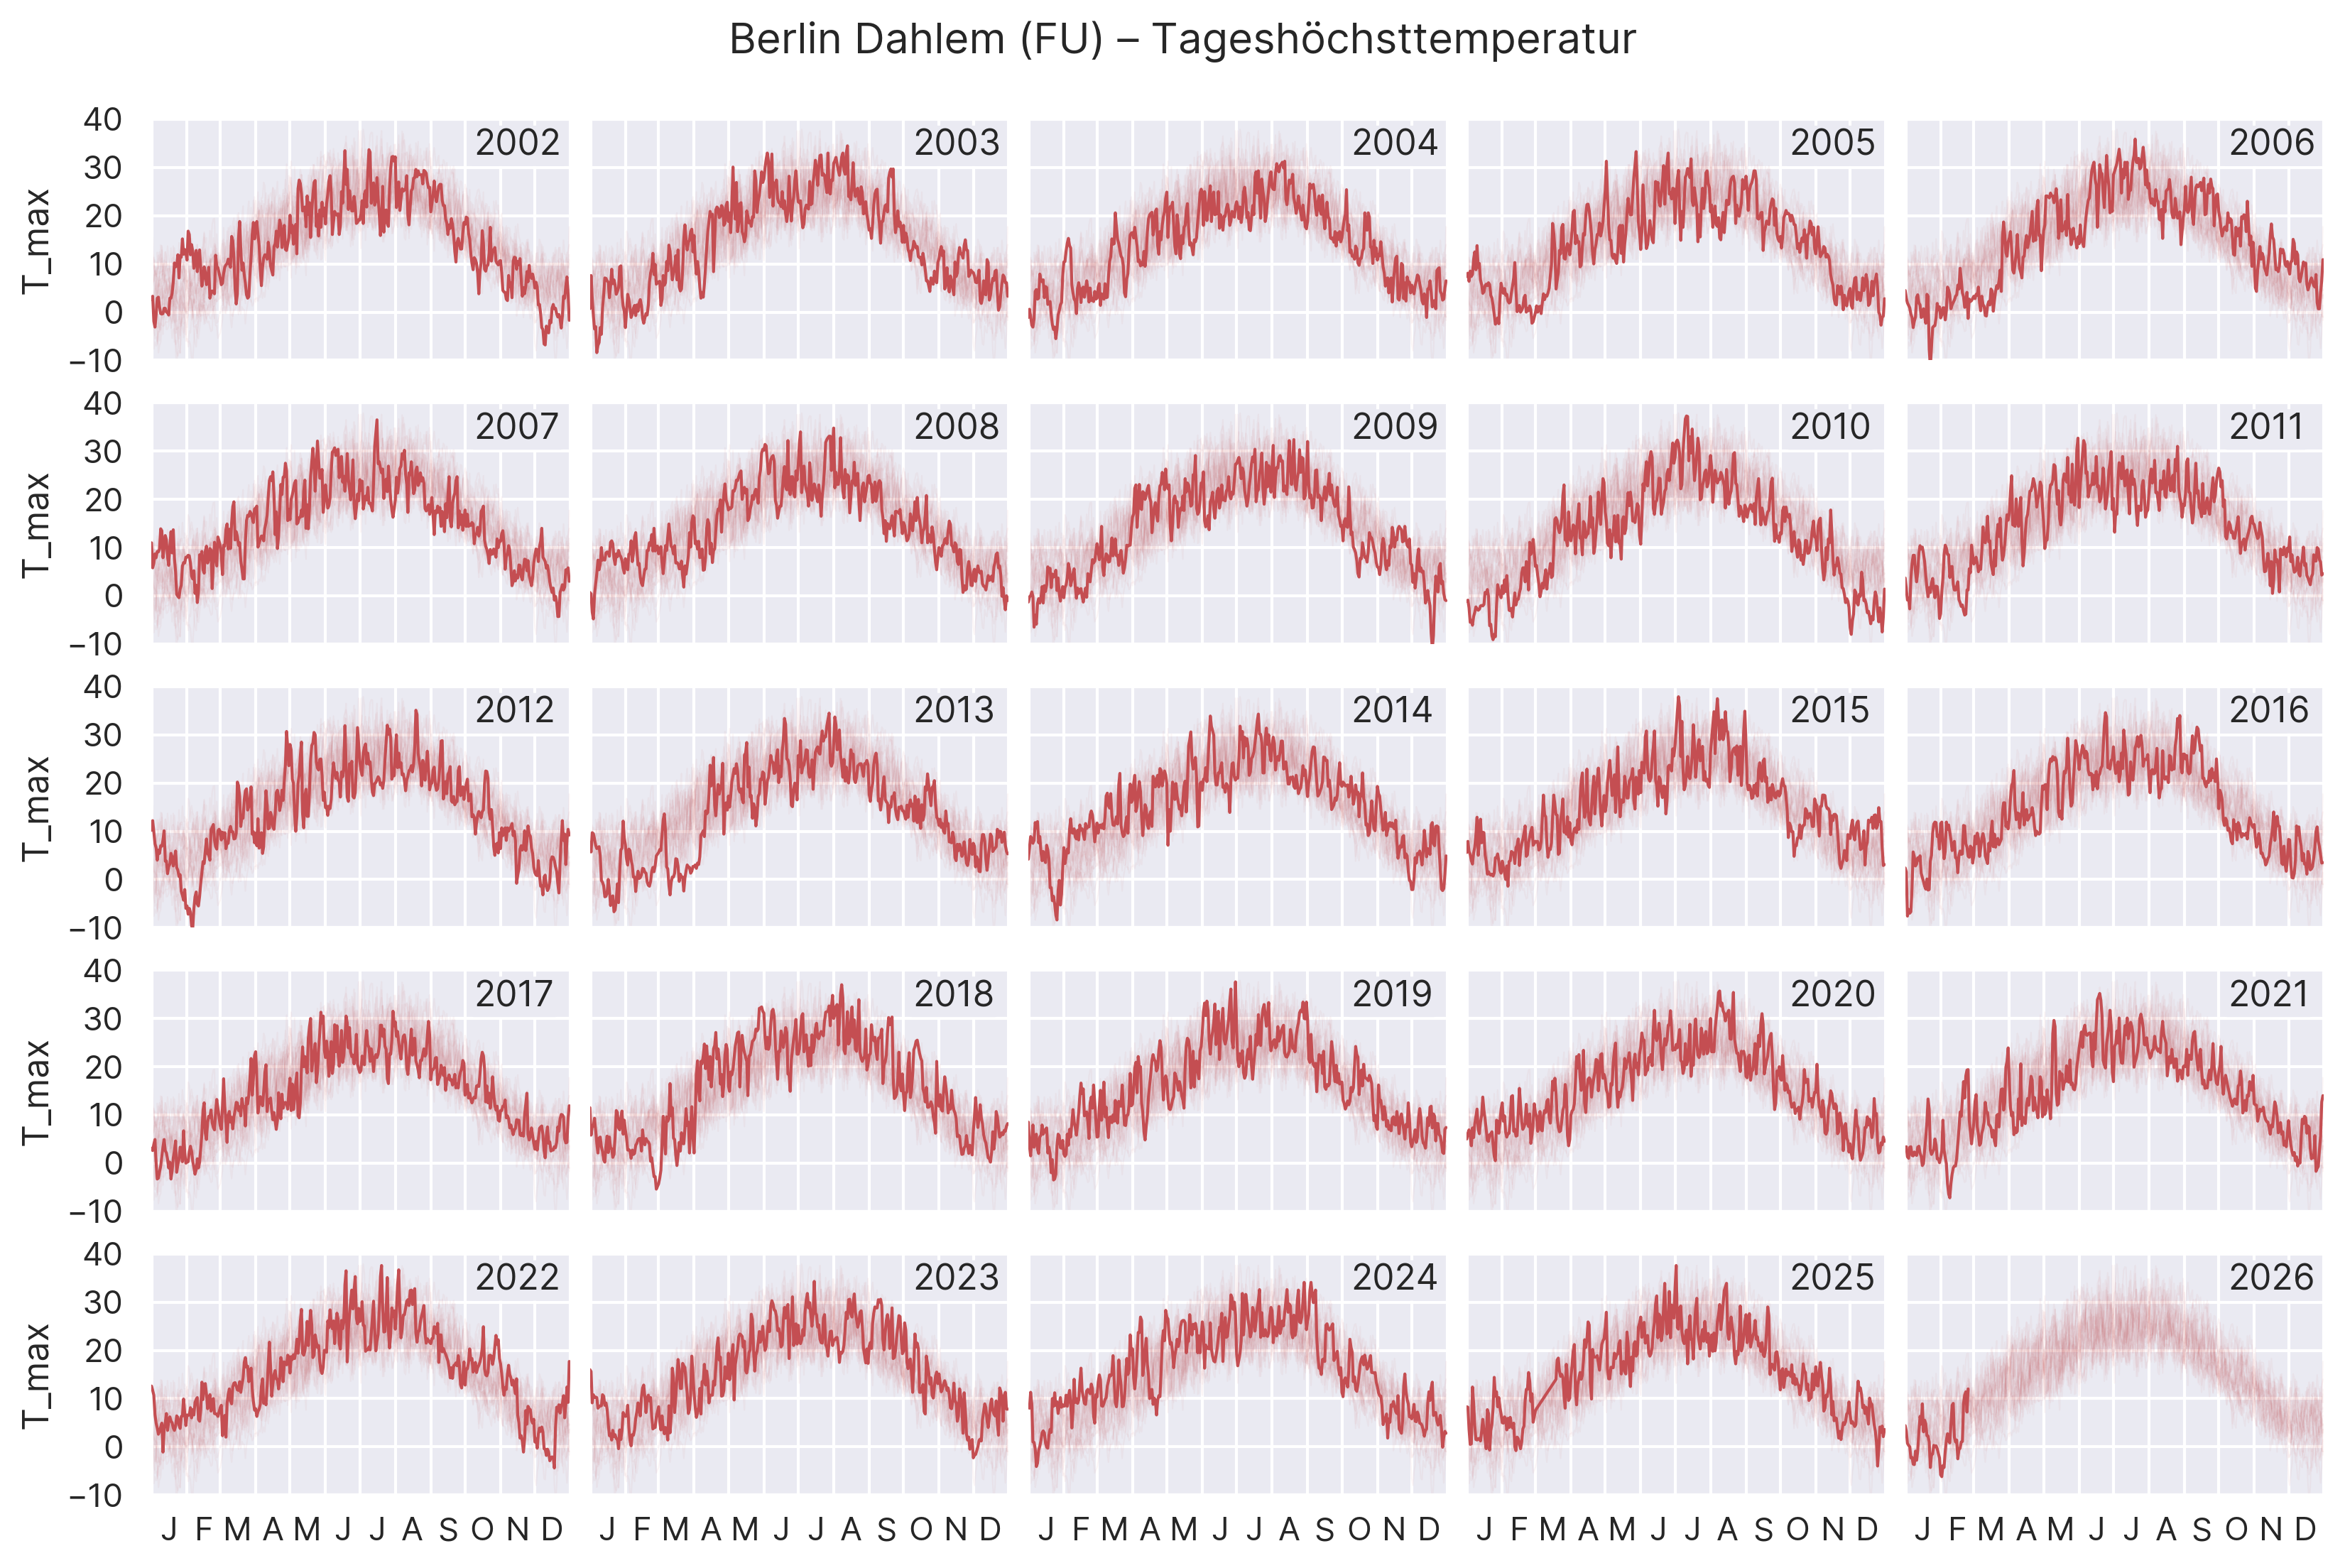
Among other things, one can clearly see the data gap in the spring of 2025 during which the FU suffered an electricity blackout lasting several (!) weeks. Another way to visualize such a time series is to aggregate the data and plot the average yearly cycle of the distribution. A really nice example for such a plot can be found on the FU’s meteorological institute’s website.
Late-July of 2022 marks one of the time periods with the highest recorded temperatures in Berlin. To understand just how severe a large city’s buildings and sealed surfaces can amplify a heat wave, we look at different weather stations in Berlin:
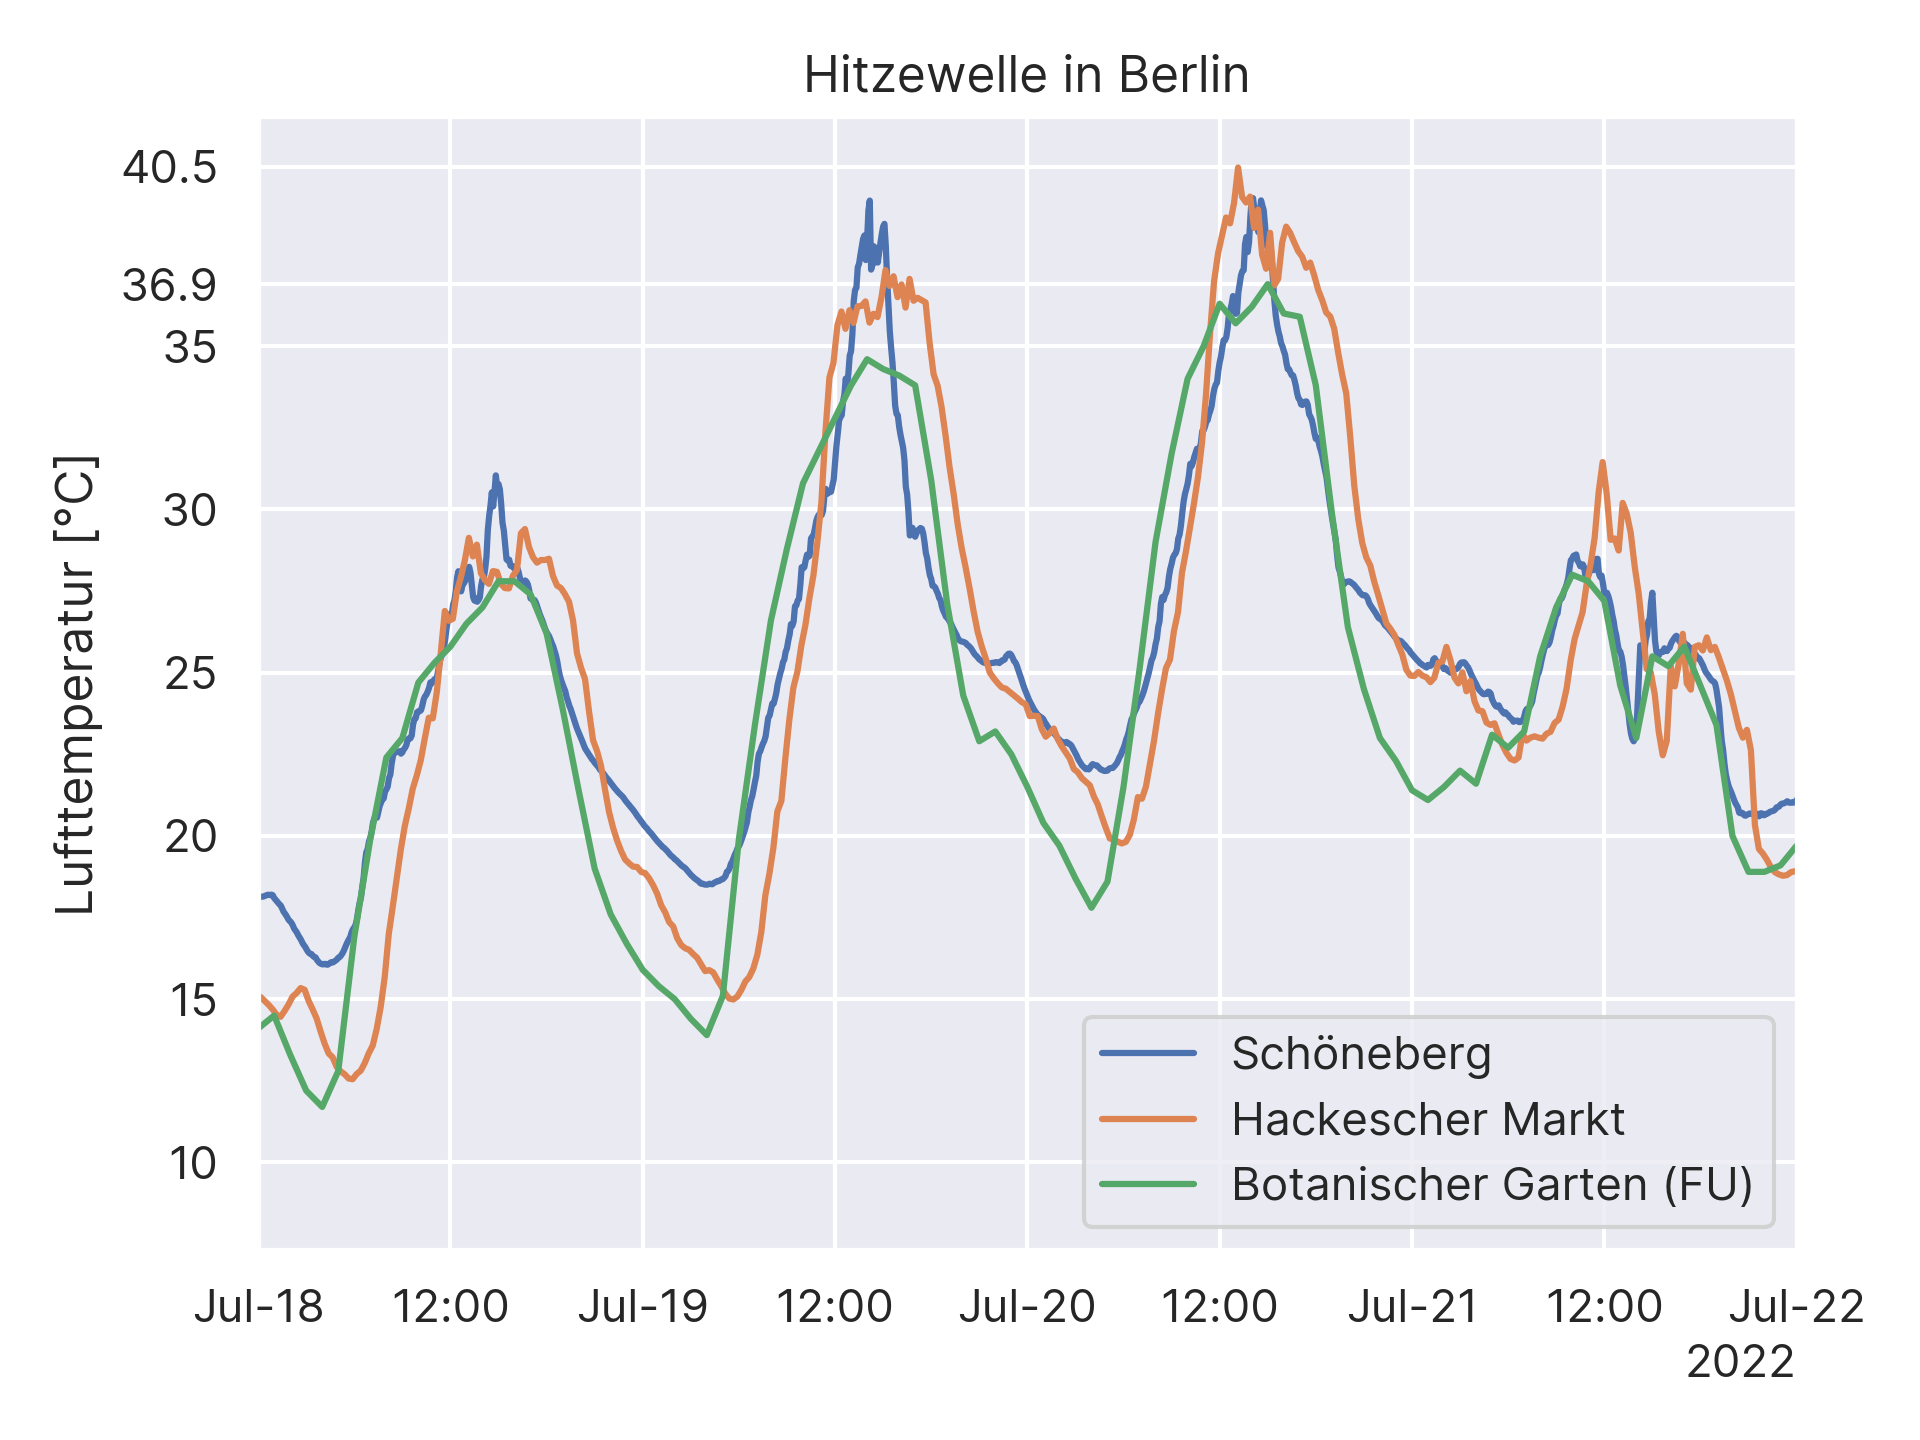
While the weather tower with its station inside the botanical garden measured “only” 36.9°C, Berlin’s city centre (Hackescher Markt) reported up to 40.5°C – an increase of almost 4°C! On top, especially in the early morning of 21st July, we see that the inner city stays warm and cannot cool as much as more greeny areas like the botanical garden.
(The temperature data for Botanischer Garten (FU) can be found on the DWD’s open data server, Schöneberg is part of the Urban Climate Observatory Berlin, and a MESSI weather station is situated at Hackescher Markt. Also note the differing measurement intervals of the raw displayed data, hence some curves look “smoother” than others.)